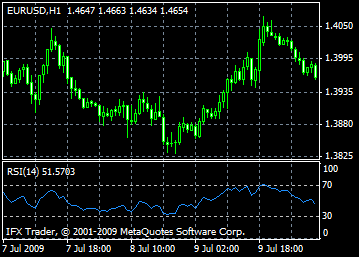
The Relative Strength Index Technical Indicator (RSI) is a price-following oscillator which ranges from 0 to 100. RSI was created by Wilder, he recommended to use a 14-day RSI. As time goes by the 9-day and 25-day Relative Strength Index indicators have also gained popularity. One of the popular methods of the RSI analysis is to look for a divergence in which the price forms a new high and the RSI is failing to surpass its previous high. This divergence is an indication of the soon reversal. If the Relative Strength Index turns down and falls below its most recent trough, it means that the RSI has completed a "failure swing". The failure swing is a confirmation of the impending reversal.
The following Relative Strength Indexes are distinguished:
Tops and bottomsThe Relative Strength Index is usually formed above 70 and below 30. They usually advance tops and bottoms formation in the price chart;
Chart Models The RSI often forms chart patterns such as head and shoulders or triangles that may or may not be visible on the price chart;
Failure swing ( Support or Resistance penetrations or breakouts) This is where the Relative Strength Index surpasses a previous high (peak) or falls below a recent low (trough);
Support and Resistance levels Levels of support and resistance are better seen at the chat of the Relative Strength Index then at the price chat.
Divergences Divergences occur when the price makes a new high (or low) but it is not confirmed by a new high (or low) in the Relative Strength Index chat. Prices usually correct and move in the direction of the RSI.
Calculation
RSI = 100-(100/(1+U/D))
Where: U - is the average number of positive price changes; D - is the average number of negative price changes.
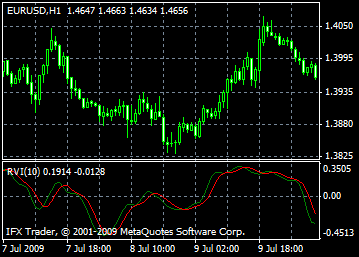
Relative Vigor Index Technical Indicator (RVI) is based on the fact that the closing price is usually higher than the opening price at the bull market. The situation is opposite on the bear market. As a result the move vigor is established by the position when the price is at the end of the period. To normalize the index to the daily trading range, price change is divided to the maximum range of prices during the day. For more detailed calculations Simple Moving Average is used. 10 is the best period. To avoid probable troubles one needs to construct an additional signal line, which is a 4-period symmetrically weighted moving average of Relative Vigor Index values. The signal to buy or sell is received when lines cross each other.
Calculation
RVI = (CLOSE-OPEN)/(HIGH-LOW)
Where: OPEN - is the opening price; HIGH - is the maximum price; LOW - is the minimum price; CLOSE - is the closing price.
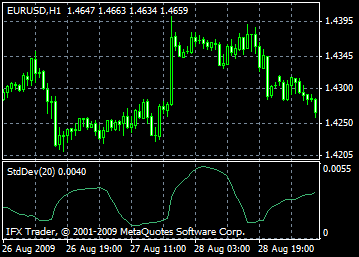
Technical Indicator Standard Deviation, StdDev measures market volatility. Indicator defines the size of the price fluctuations relatively to the moving average. For example, if indicator's value is higher a market is considered to be volatile and bars' prices spread relatively to the moving average. If indicator's value is not high a market is defined as low-volatile and bars' prices are close to the moving average.
This indicator is often used as a part of other indicators. During calculations of Bollinger Bands value of the standard deviation is added to its moving average.
Market dynamic lies in the constant alteration of the rapid falls and bursts of activity that is why this indicator is rather simple:
If indicator volume is not big and the market is stable rapid burst of activity is expected.
If indicator volume is big it often shows that activity will go in a backward direction very soon.
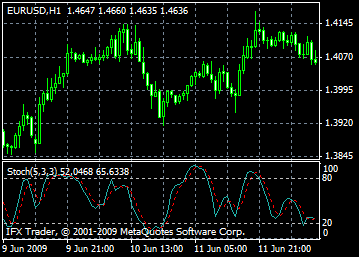
Technical Indicator Stochastic Oscillator compares current closing price with its price range for a certain time period. The Indicator is indicated as two lines. The main line is called %K. The second line, called %D, is a Moving Average of %K. The %K line is usually indicated as a firm line and the %D line is usually displayed as a dotted graph.
There are three the most popular ways to interpret a Stochastic Oscillator.
- Buy when the Oscillator (either %K or %D) falls below a certain level (as a rule 20) and then rises above this level. Sell when the Oscillator rises above a certain level (as a rule 80) and then falls below this level; - Buy when the %K line rises above the %D line. Sell if the %K line is below the %D line; - Monitor divergences. For example: prices form a series of new highs and the Stochastic Oscillator is failing to surpass its previous highs.
Calculation
The Stochastic Oscillator has four variables: - %K periods. This is the number of time periods used in the stochastic calculation; - %K Slowing Periods. This value controls the internal smoothing of %K. A value of 1 is considered a fast stochastic; a value of 3 is considered a slow stochastic; - %D periods. his is the number of time periods used when calculating a moving average of %K; - %D method. The method (i.e., Exponential, Simple, Smoothed, or Weighted) that is used to calculate %D.
The formula for %K is: %K = (CLOSE-LOW(%K))/(HIGH(%K)-LOW(%K))*100 Where: CLOSE - is today's closing price; LOW(%K) - is the lowest low in %K periods; HIGH(%K) - is the highest high in %K periods. The %D moving average is calculated according to the formula: %D = SMA(%K, N) Where: N - is the smoothing period; SMA - is the Simple Moving Average.
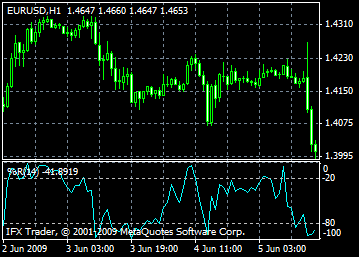
Technical Indicator Williams' Percent Range (%R) is a dynamic indicator, which determines overbought or oversold condition of the market. Williams' Percent Range is and Stochastic Oscillator are very similar. The only difference is that the first one has an upside down scale and the Stochastic Oscillator has internal smoothing.
Indicator values ranging between 80 and 100% show that the market is oversold. Indicator values ranging between 0 and 20% show that the market is overbought. When the indicator is in the upside down scale, its values usually are assigned a minus symbol (for example -30%). During analysis one may ignore the minus symbol.
All overbought/oversold indicators obey one rule: act according to the signal when prices turn happens. For example, if an overbought/oversold indicator shows an overbought condition, it is better to wait until the prices turn down before executing a sell deal.
Williams Percent Range indicator can foreseen prices reversals. The indicator almost always forms a peak and turns in backward direction a few days before the price reaches its peak and goes down. Thus, Williams Percent Range forms a trough and turns up a few days before the price goes up.
Calculation
TBelow is the formula of the %R indicator calculation, which is very similar to the Stochastic Oscillator formula: %R = (HIGH(i-n)-CLOSE)/(HIGH(i-n)-LOW(i-n))*100
Where: CLOSE - is today's closing price; HIGH(i-n) - is the highest high over a number (n) of previous periods; LOW(i-n) - is the lowest low over a number (n) of previous periods.
สกุลเงินที่เป็นที่นิยมพร้อมด้วยชื่อย่อดังรายการต่อไปนี้.- อักษรย่อ ประเทศ สกุลเงิน ชื่อเรียก USD United States Dollar Buck EUR Euro members Euro Fiber JPY Japand Yen Yen GBP Great Britain Pond Cable CHF Switzerland Franc Swissy CAD Canada Dollar Loonie AUD Australia Dollar Aussie NZD New Zealand Dollar Kiwi
 RSS Feed
 Twitter
 Wednesday, March 10, 2010
 pipsrunner