 RSS Feed
 Twitter
 Wednesday, March 10, 2010
 pipsrunner
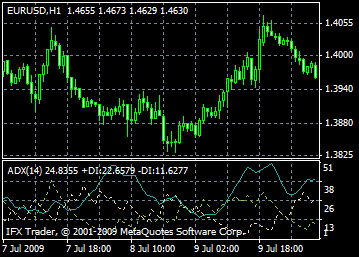
Average Directional Movement Index - ADX
Average Directional Movement Index, ADX is a technical indicator which helps to determine price trends. J. Welles Wilder was the developer who has described in details this concept in the book "New concepts in technical trading systems".
Comparison of two directional indicators 14-period +DI and 14-period –DI allows to determine the trading method at the simplest level on the basis of Directional Movement system. For calculations, charts indicators are drawn on each other, or +DI is subtracted from –DI. It is worth buying if +DI gets higher than –DI, and selling when +DI gets lower than –DI, such method was proposed by W. Wilder.
The "Extreme point rule" is an addition to the trading rules of W. Wilder. It is applied for decreasing of deals and elimination of false signals. Principle of "extreme points" is that you should mark the cross point of +DI and –DI; it will be "extreme point". +DI getting above –DI, indicates the maximal price of the day when they cross. And vice versa, if +DI gets lower than –DI, then their cross point will be the minimal price of the day. The moment of entering the market is also determined by extreme point. Getting upper than extreme point, i.e. when +DI is above –DI, it is necessary to wait for the signal and then start buying. Short position should be kept in case the price level can not exceed the level of extreme point.
Calculation
ADX = SUM[(+DI-(-DI))/(+DI+(-DI)), N]/N
Where:
N - the number of periods used in the calculation.
0 ความคิดเห็น:
Post a Comment