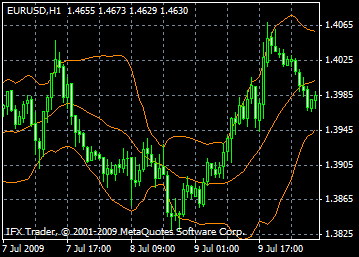
Bollinger Bands - BB
Bllinger Bands, BB, are similar to Envelopes. There is a difference between them: bounds of the envelopes are above and under the curve of moving average at the fixed, put into percentage distance, but bounds of Bollinger bands are constructed on the basis of distances which are equal to a certain quantity of standard divergences. The value of standard divergence depends on volatility, so bands control their width: it increases, when market is not stable, and it decreases at the stable periods.
Bollinger Bands are usually drawn on the price chart, but they can be drawn on the indicator chart as well. As in case with moving average envelopes, interpretation of Bollinger bands is based upon the fact that prices usually stay in the range of upper and bottom bounds of a band.
Peculiarity of Bollinger Bands is their variable width conditioned by the price volatility. In the periods of considerable price changes (i.e. high volatility) bands widen giving the space for prices. In the periods of stagnation (i.e. low volatility) bands converge, keeping the prices within the bounds.
Peculiarities of Bollinger bands:
1. Sudden price changes usually occur after the band's stagnation indicating the decrease of volatility.
2. If prices transcend the band bounds, then the current trend will continue.
3. If after the peaks and cavities outside the band, the peaks and cavities inside the band follow, then the trend reverse is probable.
4. Price movement started from one of the band's bounds usually reaches the opposite bound. Last observation is useful for forecasting of the price targets.
Last observation is very useful for price targets forecasting.

Calculation
Bollinger bands are formed by three lines. The middle line (ML) is a usual Moving Average.
ML = SUM [CLOSE, N]/N
The top line, TL, is the same as the middle line a certain number of standard deviations (D) higher than the ML.
TL = ML + (D*StdDev)
The bottom line (BL) is the middle line shifted down by the same number of standard deviations.
BL = ML - (D*StdDev)
Where:
N - is the number of periods used in calculation;
SMA - Simple Moving Average;
StdDev - means Standard Deviation.
StdDev = SQRT(SUM[(CLOSE - SMA(CLOSE, N))^2, N]/N)
It is recommended to use 20-period Simple Moving Average as the middle line, and plot top and bottom lines two standard deviations away from it. Besides, moving averages of less than 10 periods are of little effect.
 RSS Feed
 Twitter
 Wednesday, March 10, 2010
 pipsrunner
0 ความคิดเห็น:
Post a Comment