 RSS Feed
 Twitter
 Wednesday, March 10, 2010
 pipsrunner
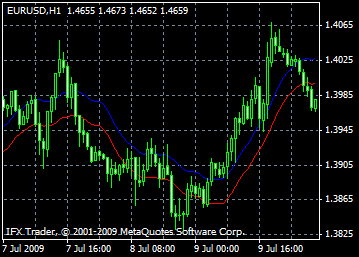
Envelopes
One of two moving averages is shifted upwards, another moves downwards – they form technical indicator Envelopes. Choosing of optimum relative magnitude of band's bounds shift is determined by the market volatility: the more the shift, the more the relative number.
Price fluctuation of securities is determined by the top and bottom borders of Envelopes. If price reaches bottom bound, there appears purchase signal, if price touches upon the top border, signal for selling appears.
Using of technical indicator Envelopes is based upon the usual logic of market behavior, i.e. under the pressure of great number of people who want to buy or sell, prices reach their point of extremum (i.e. top or bottom border of band), getting to the normal level they become stable. The same principle is used for Bollinger Bands (BB) interpretation.
Calculation
Upper Band = SMA(CLOSE, N)*[1+K/1000]
Lower Band = SMA(CLOSE, N)*[1-K/1000]
Where:
SMA - Simple Moving Average;
N - averaging period;
K/1000 - the value of shifting from the average (measured in basis points).
0 ความคิดเห็น:
Post a Comment