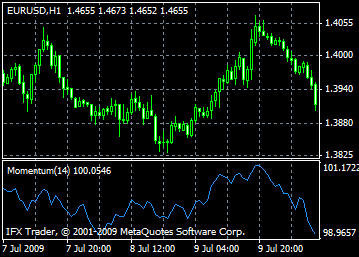
Momentum
An Indicator which measures amount of the financial instrument price change for a certain period is called the Momentum Technical Indicator. There are two main methods of the Momentum indicator usage:
An Indicator which measures amount of the financial instrument price change for a certain period is called the Momentum Technical Indicator. There are two main methods of the Momentum indicator usage:
As a trend-following oscillator, similarly to Moving Average Convergence/Divergence MACD. A signal to buy occurs when the Momentum indicator forms a trough and starts its growth; a signal to buy occurs when the Momentum indicator reaches its peak and turns down. For more exact calculation of the indicator's reverse its short moving average is used.
The Continuation of the current tendency is determined if the Momentum indicator has either very high or very lower values. If the indicator reaches high values and then turns down further prices growth is expected. But, in any case, do not hurry to open (close) position until the prices prove the indicator's signal.
As a lending indicator. This method is based on the supposition that the final phase of the uptrend are usually accompanied by the high increase of prices (because everybody believes in it continuation) and completion of the bullish market by the rapid fall of the prices (because everybody tries to leave the market).
When the market is closed to the top it is accompanied by the rapid break of the Momentum indicator. Then the indicator starts to fall while the prices continues to rise and move horizontally. In the market bottom the Momentum falls suddenly and then turns up long before the prices start to rise. In both cases divergences occur between the indicator and prices.

Calculation
Momentum is calculated as a ratio of today's price to the price several (N) periods ago.
MOMENTUM = CLOSE(i)/CLOSE(i-N)*100
Where:
CLOSE(i) - is the closing price of the current bar;
CLOSE(i-N) - is the closing bar price N periods ago.
 RSS Feed
 Twitter
 Wednesday, March 10, 2010
 pipsrunner
0 ความคิดเห็น:
Post a Comment