 RSS Feed
 Twitter
 Wednesday, March 10, 2010
 pipsrunner
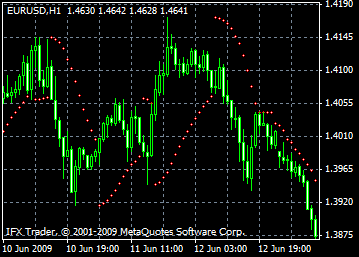
Parabolic SAR
Parabolic SAR Technical Indicator was developed for analyzing the trending markets. The indicator is constructed on the price chart. This indicator is similar to the Moving Average Technical Indicator with the only difference that Parabolic SAR moves with higher acceleration and may change its position in terms of the price. The indicator is placed below the prices at the bull market (Up Trend), and it is placed above the prices at the bearish market (Down Trend).
If the price crosses Parabolic SAR lines, the indicator turns, and its next value is placed opposite the price. When indicator turns, the maximum or the minimum price is considered to be the starting point for the previous period. Indicator turn is a signal that either the trend completes (correction stage or flat), or is going to turn.
The Parabolic SAR determines market exit points. Long positions should be closed when the price falls below the SAR line, short positions should be closed when the price rises above the SAR line. The indicator is often used as a trailing stop line.
If the long position is open the Parabolic SAR line goes up, regardless of what direction the prices take. The length of the SAR line movement depends on the scale of the price movement.
Calculation
SAR(i) = SAR(i-1)+ACCELERATION*(EPRICE(i-1)-SAR(i-1))
Where:
SAR(i-1) - is the value of the indicator on the previous bar;
ACCELERATION - is the acceleration factor;
EPRICE(i-1) - is the highest (lowest) price for the previous period (EPRICE=HIGH for long positions and EPRICE=LOW for short positions). The indicator value increases if the price of the current bar is higher than previous bullish and vice versa. The acceleration factor (ACCELERATION) will double at the same time, which would cause Parabolic SAR and the price to come together. In other words, the faster the price grows or sinks, the faster the indicator approaches the price.
0 ความคิดเห็น:
Post a Comment